• How to monitor AI agent applications on Amazon Bedrock AgentCore with Grafana Cloud Today’s AI agents have grown increasingly sophisticated, moving into production environments and becoming integral parts of engineering workflows. • But these agents can also be black boxes for engineers, which makes observability more critical than ever. • Without proper monitoring, you’re often left feeling like you’re flying blind as you try to debug agent failures, understand performance bottlenecks, and track costs. • We want to put our users back in control, so in this tutorial you’ll learn how to deploy an AI agent on Amazon Bedrock AgentCore with full observability powered by OpenTelemetry and Grafana Cloud. • More specifically, you’ll learn how to: 1. • Deploy AI agents on AWS Bedrock AgentCore for managed, scalable production runtime 2.
Article Summaries:
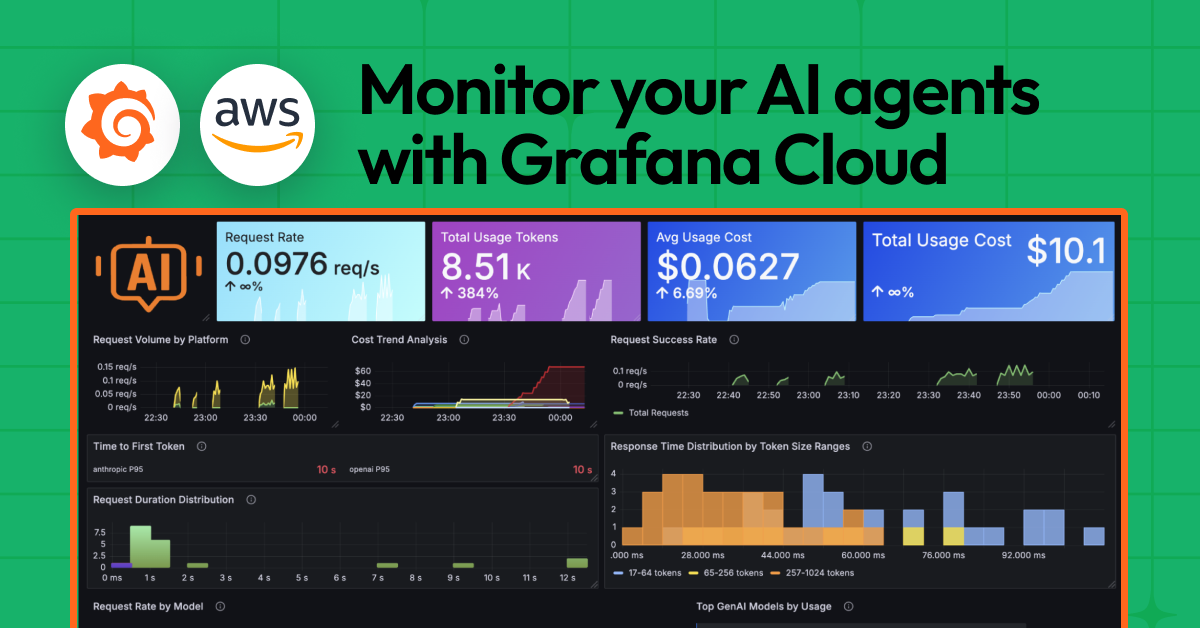
- Amazon has released a new tutorial that shows how to deploy AI agents on its Bedrock AgentCore service and add full observability with Grafana Cloud. The guide walks users through launching agents in the managed, serverless Bedrock runtime, instrumenting them automatically with OpenTelemetry via the OpenLit wrapper, and sending telemetry to Grafana Cloud. It highlights how to monitor agent performance, trace distributed calls, and track token usage and costs through AI‑observability dashboards. The post also notes Bedrock AgentCore’s managed infrastructure, native model access, and enterprise security features, positioning it as a turnkey solution for production‑grade AI agent orchestration.
- AWS has released guidance on monitoring its Bedrock AgentCore AI agent infrastructure using Grafana Cloud. Bedrock AgentCore, a serverless platform for building generative‑AI agents, emits rich telemetry that can be captured via OpenTelemetry and Amazon CloudWatch. By forwarding this data to Grafana Cloud, operators gain unified dashboards and alerts for key metrics such as latency, token usage, and tool‑execution reliability. The integration supports multi‑account, multi‑region deployments, eliminating data silos and providing a single pane of glass for infrastructure and application observability. The post is the second part of a two‑part guide, with the first part covering application‑layer monitoring.
Sources: