• Introducing Path Analysis: A New Way to Visualise Traceroute Changes in RIPE Atlas Stephen Suess Based in Amsterdam UX/UI/Frontend Developer with the RIPE NCC since February 2019.More 4 min read Share RIPE Atlas now includes a new path analysis tool that makes it easier to understand how traceroute paths evolve over time. • By comparing runs side by side, it highlights where the path changed and what kind of change it was. • This gives you a fast, visual starting point for incident investigation, validation work, and troubleshooting without having to manually scan hop-by-hop traceroute output. • Traceroute data is invaluable for understanding network behaviour, but comparing the same traceroute over time manually is tedious. • When investigating an incident, you might need to answer questions like: When did the path to my target change? • Did my traffic shift to a different AS or IXP?
Article Summaries:
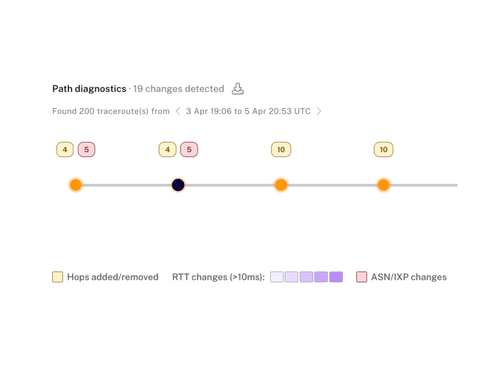
- RIPE Atlas has added a path‑analysis feature that visualises how traceroute routes change over time. By placing two runs side‑by‑side, the tool highlights differences with colour‑coded markers-yellow for routing changes, purple for RTT degradation, and red for ASN/IXP shifts. Users can explore changes sequentially via an interactive timeline or compare two specific periods directly. The visual approach speeds incident investigation, maintenance validation, ongoing monitoring, and latency troubleshooting, allowing operators to pinpoint when and where traffic diverges without manually scanning hop‑by‑hop data.
Sources: