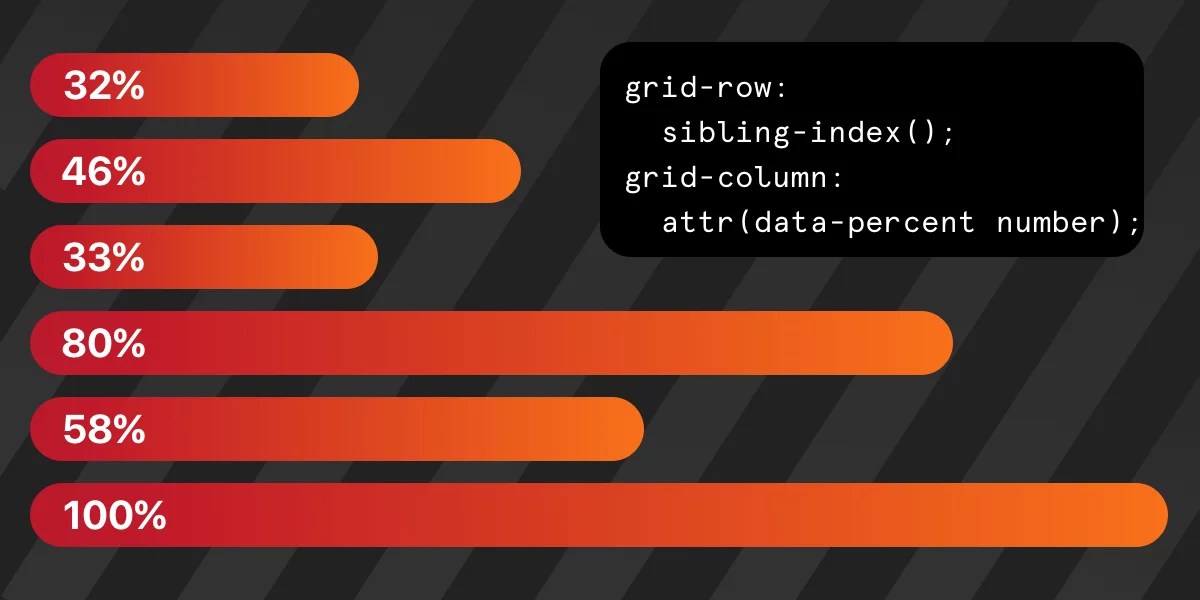
• New CSS features can sometimes make it easier and more efficient to code designs we already knew how to create. • This efficiency could stem from reduced code or hacks, or improved readability due to the new features. • In that spirit, let’s revamp what’s under the hood of a bar chart. • 32% We begin by laying out a grid. • .chart { display: grid; grid-template-rows: repeat(100, 1fr); /* etc. • */ } The chart metric is based on percentage, as in “some number out of 100.” Let’s say we’re working with a grid containing 100 rows.
Article Summaries:
- The article explains how recent CSS functions-specifically
sibling-index()and the upgradedattr()-enable developers to build bar charts using only CSS and HTML. By defining a 100‑row grid and assigning each bar a column viasibling-index()and a height viaattr(data-value number), designers can create responsive, data‑driven charts without JavaScript or complex CSS variables. The piece notes that while the approach reduces code and improves readability, browser support is uneven:sibling-index()works in the latest Chrome and Safari but not yet on Firefox or iOS, andattr()now accepts data attributes but still requires fallbacks for older browsers.
Sources: